

Excel occasionally has some issues that are not always obvious to solve. This particular one was very difficult and I could not find any solutions that explained it. So I've included here how I solved this particular issue with some helpful screenshots to illustrate it.

2. The dates initially looks correct

3. But converting them to the “General” Format
shows some dates are not being converted properly. Excel stores dates as a
string of numbers so if the date doesn’t covert to a number when you switch to
general there is something wrong with those particular values.

4. To fix this double click on each of the cell
which didn’t convert to a number and hit enter. Now reconvert all the cells
again to “General” Format. You can see then that all the values are being stored properly as numbers.

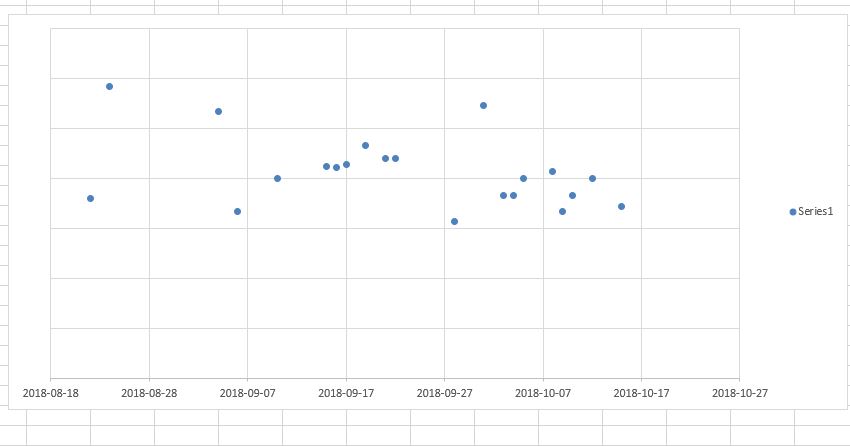
5. Select all the cells and convert it back to "Dates." The graph should now be fixed


+copy2.jpg)


0 comments:
Post a Comment
Note: only a member of this blog may post a comment.